Global Superstore is a global online retailer based in New York, boasting a broad product catalogue and aiming to be a one-stop-shop for its customers. Its clientele, hailing from 147 different countries, can browse through an endless offering with more than 10,000 products. This large selection comprises three main categories: office supplies (e.g., staples), furniture (e.g., chairs), and technology (e.g., smartphones).
The aim of this analysis is to show the countries that generated the highest profit,
The products that generated the highest revenue, shipping costs, the least profitable
Country and a lot more.
This dataset was cleaned and sorted using excel, queried using SQL and visualized using Power Bi.

Summarily, I used SQL to analyze the top countries that generated the most profit using SUM, GROUP BY, ORDER BY function and LIMIT, along with the key contributing products.
Using the BETWEEN function, I assessed Nigeria’s profit for 2014 which gave us a loss. I also used the inner join to join two tables together to get customers who returned goods.
Questions
1)Which top 3 countries generated the highest profit and which products contributed to this?
2)Which sub categories have the highest avg shipping cost in USA?
3)What is the cause for Nigeria’s poor performance?
4)What is the total revenue for the period?
5)Which city is the least profitable in USA?
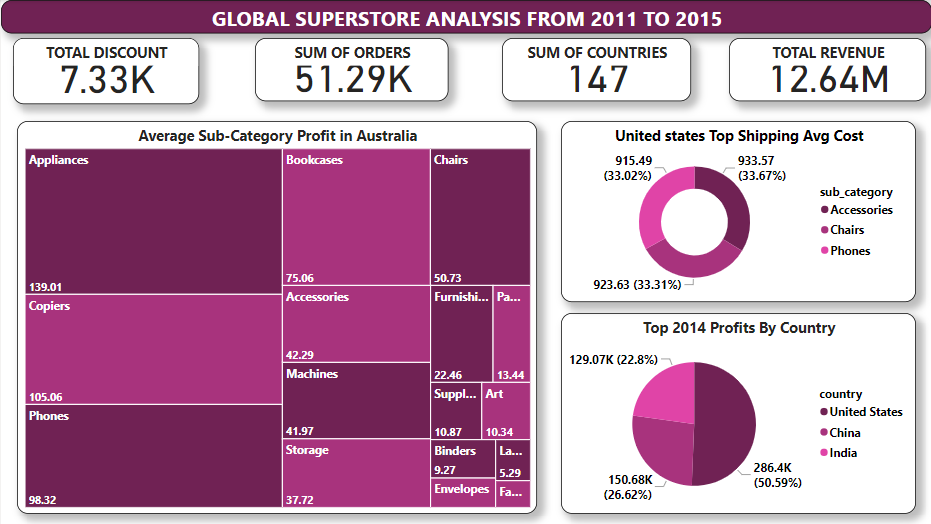
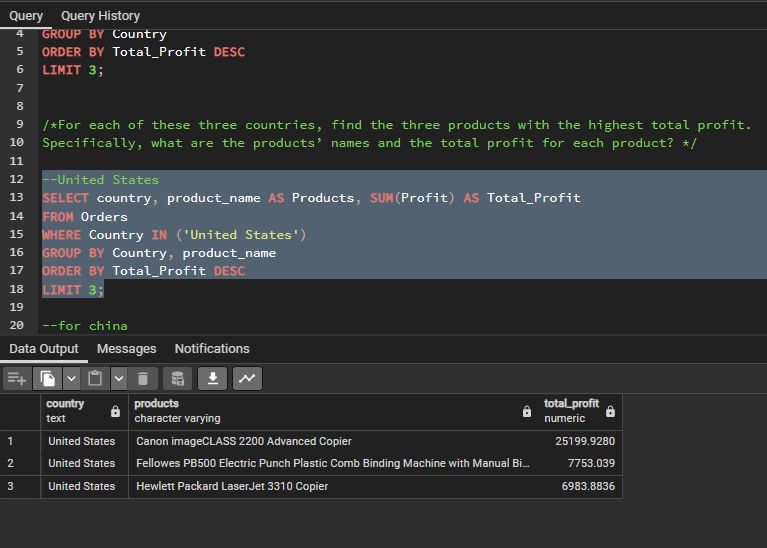
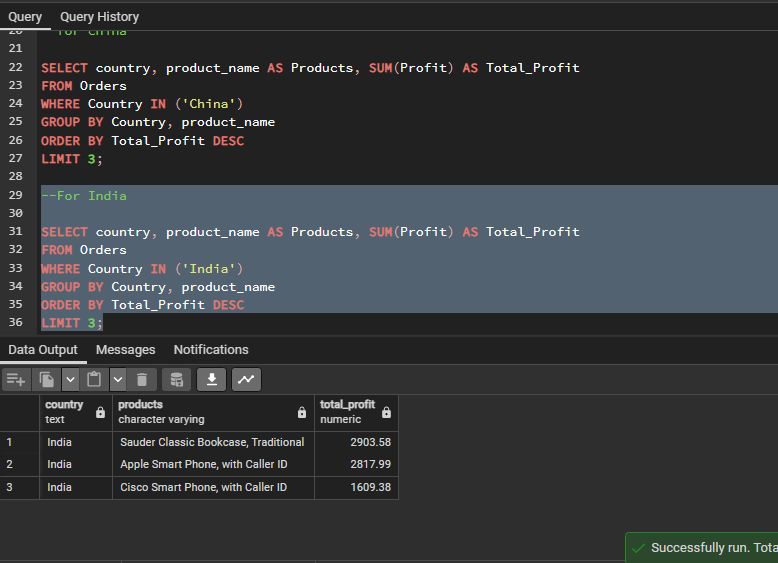
The provided dashboard answers most of the questions. The pie chart shows that United States, China and India generated the highest profit of all countries. While the most sold product in the US was Canon imageCLASS 2200 Advanced Copier as shown below, China and India most sold products are Sharp Wireless Fax, Digital and Sauder Classic Bookcase, Traditional.
These 3 products seem to be doing well in these countries, therefore it is advisable to stock up on them as frequently as possible.
-USA’s Top 3 Products
-China’s Top 3 Products

-India’s Top 3 Product
Furthermore, Accessories, Chairs and Phones are the sub_categories with the highest shipping costs in the United States. Here, the branches have to be careful while calculating shipping costs to prevent losses. Also, it is advisable to encourage customers to make bulk purchases in this situation to avoid discouragement and if affordable, discount can be given to drive sales.
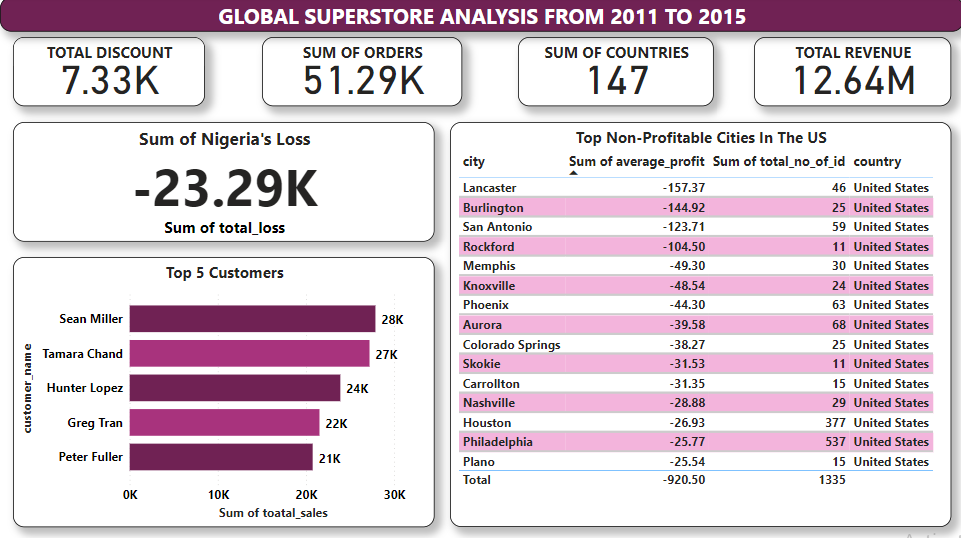
The visualization gives insight on the least profitable city in USA which is Lancaster followed by Burlington with an average loss of -157.37 and -144.92. This can be as a result of different factors ranging from financial constraints among customers or having a scale of preference and opting for a cheaper option. Similarly, Nigeria experienced a substantial loss of -23285.190 over the years, likely due to widespread poverty, with many citizens struggling to make ends meet on a daily basis so the result of the loss cannot be far fetched.
In conclusion, Global Superstore should increase advertising efforts for their top-selling products in the USA, China, and India, while also implementing cost-cutting measures in less profitable cities. Also, it should meticulously calculate average shipping costs to minimize errors and offer discounts to increase sales and enhance competitiveness.


